Measurement
Last time
Validity (4 types)
- Construct
- Statistical Conclusion
- Internal
- External
Today
Let’s talk about construct validity and measuring what we want to measure.
- BUT before we talk about construct validity, we must first discuss conceptual clarity.
Conceptual clarity (Bringmann, Elmer, & Eronen, 2022)
- Identifying and characterizing the concept of study
- This is independent of measurement and must happen before measurement
- Why is conceptual clarity important?
How to evaluate and improve conceptual clarity
- Iterate, iterate, iterate
- Explicitly discuss in empirical (and non-empirical) work
- Justify the use of measures for concept
- Use multiple measures (multiverse analysis)
How to evaluate and improve conceptual clarity
- Conduct studies on concepts before studying how they relate to over variables, change over time, can be manipulated, etc.
- Use qualitative methods to understand how participants interpret measures.
Once a concept has been clarified, the next step is to measure it. Usually, we find that our concept is a…
- LATENT VARIABLE
Quantitude podcast
According to Curran and Hancock, what is a latent variable?
What are some examples of latent variables in the podcast?
Bollen (2002)
Definitions of latent variables:
Informal
- Hypothetical construct
- Unmeasureable
- Data reduction
Formal
- Local independence
- Expected value
- Nondeterministic function
Sample realization definition: A latent random (or nonrandom) variable is a random (or nonrandom) variable for which there is no sample realization for at least some observations in a given sample.

Measuring latent variables
If latent variables are unobserved, how do we study them?
The challenge of psychometrics is assign numbers to observations in a way that best summarizes the underlying constructs (Revelle, 2009)
How do we create this in our dataset (practically speaking)?
With the people around you, come up with one latent variables that you might be interested in and describe how you would measure them.
Thinking about measurements
What questions should we ask ourselves as we construct latent variables?
What else does our measure capture?
(If multiple items) are all items weighted equally?
(If multiple items) are items causal indicators or effect indicators?
Is our latent variable a posteriori and a priori?
Relationship between latent variables and theory
Latent variables live at the level of theory.
Your theory is about success/happiness/arousal/memory/etc, not about the measure (items or operationalizations).
Does your theory specify how the latent variable is associated with your measure?
- Probably not… we’ll return to this.
Relationship between latent variables and theory
Do you need theory for good statistics or empirical work?
Machine learning models
- Don’t need theory to make predictions.
- In fact, best predictions often come by throwing out theory.
Network models (not social)
- No underlying theory about the cause of covariation between items.
- Allows for exploration of item structure.
- E.g., work on depression
What’s wrong with latent variables

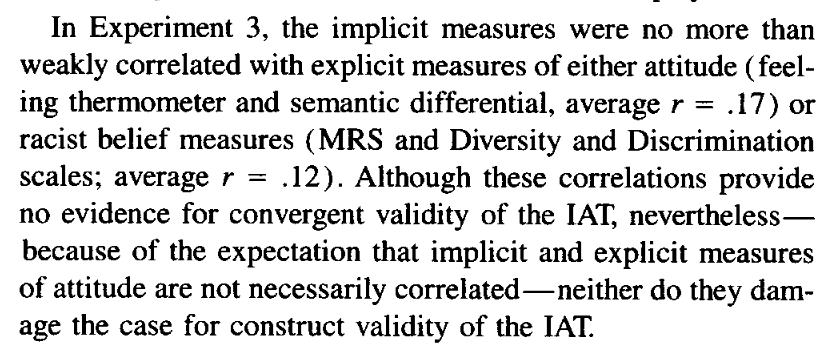
Borsboom (2006) argues that good measurement practices – specifically, testing that measures capture latent variable – has been ignored in psychology.
- Operationalizations assumed substitutes for latent variables
- No exploration or tests of whether measure captures latent variable
- Construct validity (Cronbach & Meehl, 1955, among others) made to seem too difficult
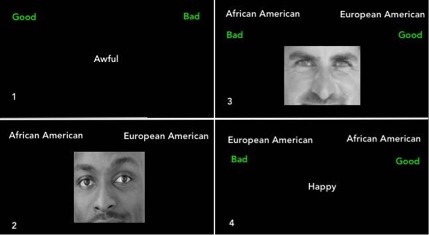
IAT
IAT
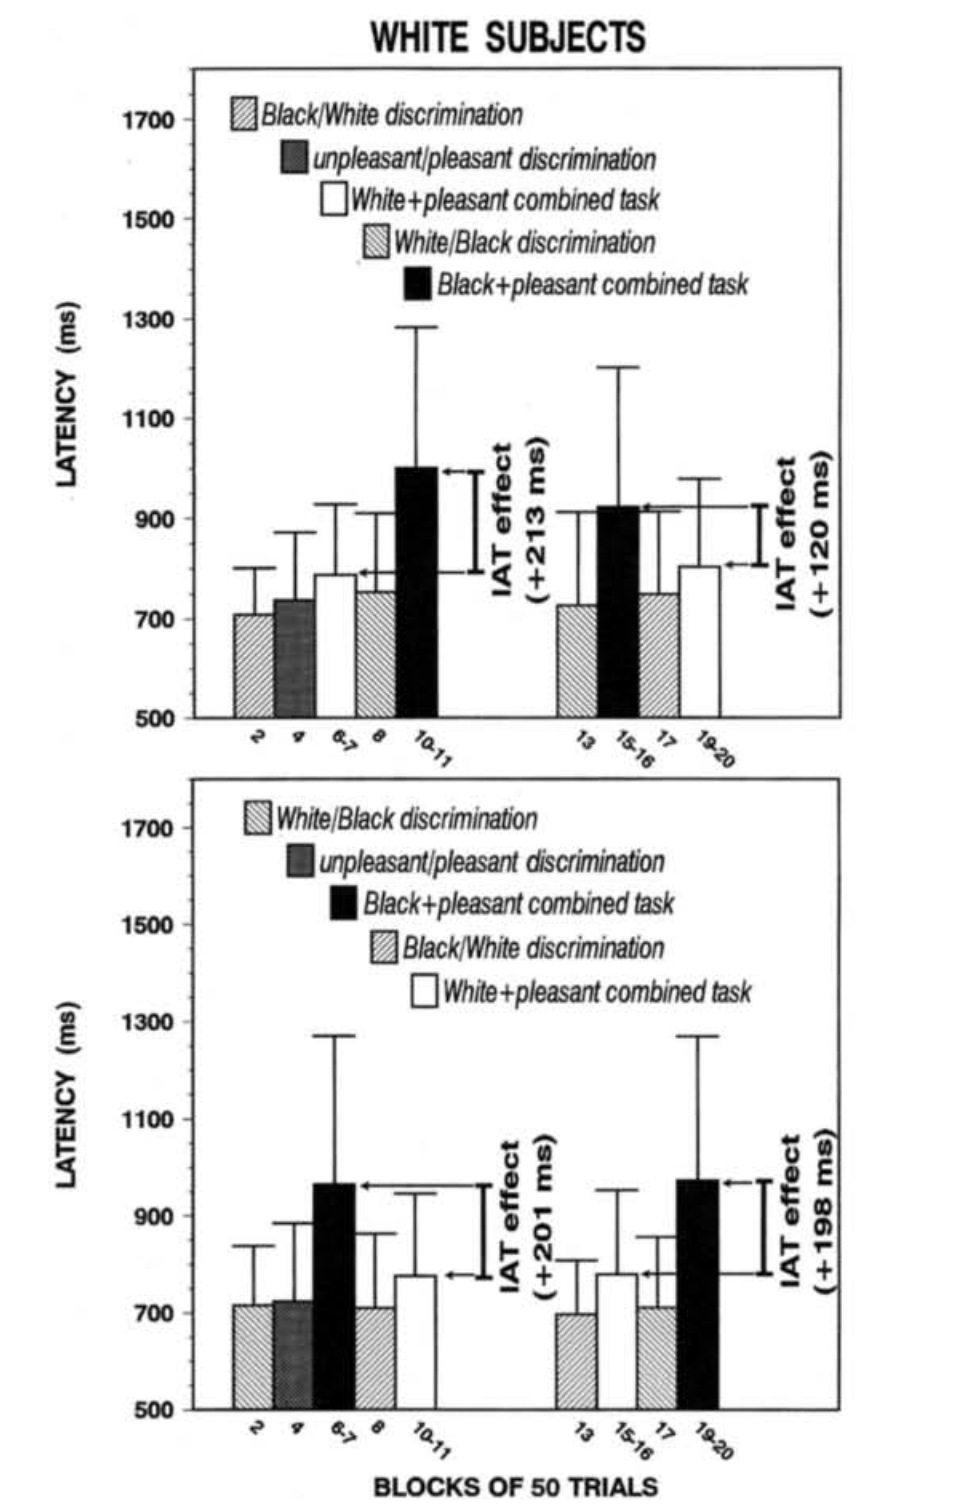
From Greenwald, McGhee, & Schwartz (1998)
IAT
From Greenwald, McGhee, & Schwartz (1998)
The underlying process
Where do the numbers come from?
What assumptions do our statistics make about where the numbers come from?
A few examples from Revelle (2009)
Whose point of view?
Consider the problem of a department chairman who wants to recruit faculty by emphasizing the smallness of class size but also report to a dean how effective the department is at meeting its teaching requirements. What is the typical class size?
Whose point of view?
| Faculty Member | Freshman/ Sophmore | Junior | Senior | Graduate | Mean | Median |
|---|---|---|---|---|---|---|
| A | 20 | 10 | 10 | 10 | 12.5 | 10 |
| B | 20 | 10 | 10 | 10 | 12.5 | 10 |
| C | 20 | 10 | 10 | 10 | 12.5 | 10 |
| D | 20 | 100 | 10 | 10 | 35.0 | 15 |
| E | 200 | 100 | 400 | 10 | 177.5 | 150 |
| Total | ||||||
| Mean | 56 | 46 | 110 | 10 | 50.0 | 39 |
| Median | 20 | 10 | 10 | 10 | 12.5 | 10 |
What about from the students’ perspective?
| Class size | Number of classes | Number of students |
|---|---|---|
| 10 | 12 | 120 |
| 20 | 4 | 80 |
| 100 | 2 | 200 |
| 200 | 1 | 200 |
| 400 | 1 | 400 |
[1] "Mean = 222.8"[1] "Median = 200"Is the process generating numbers linear?
Many of the statistics we use (e.g., mean) assume the process generating numbers is linear. That is, as you move up on the latent construct, you move in a linear fashion along the measurement. What happens if that’s not the case?
Scores indicate the time of day the subject experienced their peak.
| Subject | Energetic Arousal | Positive Affect | Tense Arousal | Negative Affect |
|---|---|---|---|---|
| 1 | 9 | 14 | 19 | 24 |
| 2 | 11 | 16 | 21 | 2 |
| 3 | 13 | 18 | 23 | 4 |
| 4 | 15 | 20 | 1 | 6 |
| 5 | 17 | 22 | 3 | 8 |
| 6 | 19 | 24 | 5 | 10 |
| Mean | ||||
| Arithmetic | 14 | 19 | 12 | 9 |
| Circular | 14 | 19 | 24 | 5 |
Non-linearirty and pre-existing differences
The issues of non-linearity are especially troublesome when there are pre-existing differences between groups. This can lead to interactions at the level of the observations (measures/operationalization) even when there are not interactions at the level of the latent variable.
Non-linearirty and pre-existing differences
Consider a study of “thematic analysis” across three schools:
- a “high-quality, high prestige 4-year liberal arts college located in New England” (Ivy)
- a “4-year state supported institution, relatively nonselective, and enrolling mostly lower-middle-class commuter students who are preparing for specific vocations such as teaching” (TC)
- a community college (CC).
(From Winter & McClelland, 1978)

What is your conclusion?

What is your conclusion?


Both panels are generated from the exact same monotonic curve, but with items of different difficulties.
\[prob(correct|\theta,\delta) = \frac{1}{1+e^{\delta-\theta}}\]
Takeaways
- Latent variables are not directly measured for at least some people in a given sample
- We try to infer the value of a latent variable through our observed variable(s)
- In doing so, we must bring theory to bear, not only on how the latent variable connects to other (latent) variables or constructs, but specifically how our latent variable is related to our operationalization
- Misspecifying the relationship between latent variables and operationalizations can result in misleading or wrong results.
Next time…
Describing data